
An abstract three-layer computing stack connected by a task graph and enclosed by a reliability boundary
← Recent publications

Featured work · DAC 2026

XRel-Graph

Graph learning for cross-layer reliability management.

A design-time method that treats reliability as a coordinated allocation problem: each task receives the least costly protection that still keeps the complete mixed-criticality application safe and schedulable.

Authors

Behnaz Ranjbar · Siva Satyendra Sahoo · Rohit Yalavarthy · Akash Kumar

Publication avenue

63rd ACM/IEEE Design Automation Conference · DAC 2026

Event

26–29 July 2026 · Long Beach, California, USA
01

Coupled consequences

The systems question

A mixed-criticality DAG is a chain of consequences—not a list of tasks.

A protection decision changes more than one task. Replication raises peak power, re-execution consumes downstream slack, and a checkpoint alters both timing and recovery cost. XRel-Graph starts from this coupling: reliability must be composed over the task graph while the entire application remains within its deadline.

Reliability composes

Local choices create a system-level PFH.

The relevant safety quantity is the probability of failure per hour (PFH) for the complete application, not a per-task score in isolation. Failure probabilities accumulate through high- and low-criticality paths, so a cheap local choice can invalidate the application contract.

Slack propagates

Recovery time is borrowed from successors.

Temporal redundancy can be efficient for one node yet delay every dependent node. The useful decision therefore depends on topology, mapping, criticality, and remaining end-to-end slack.

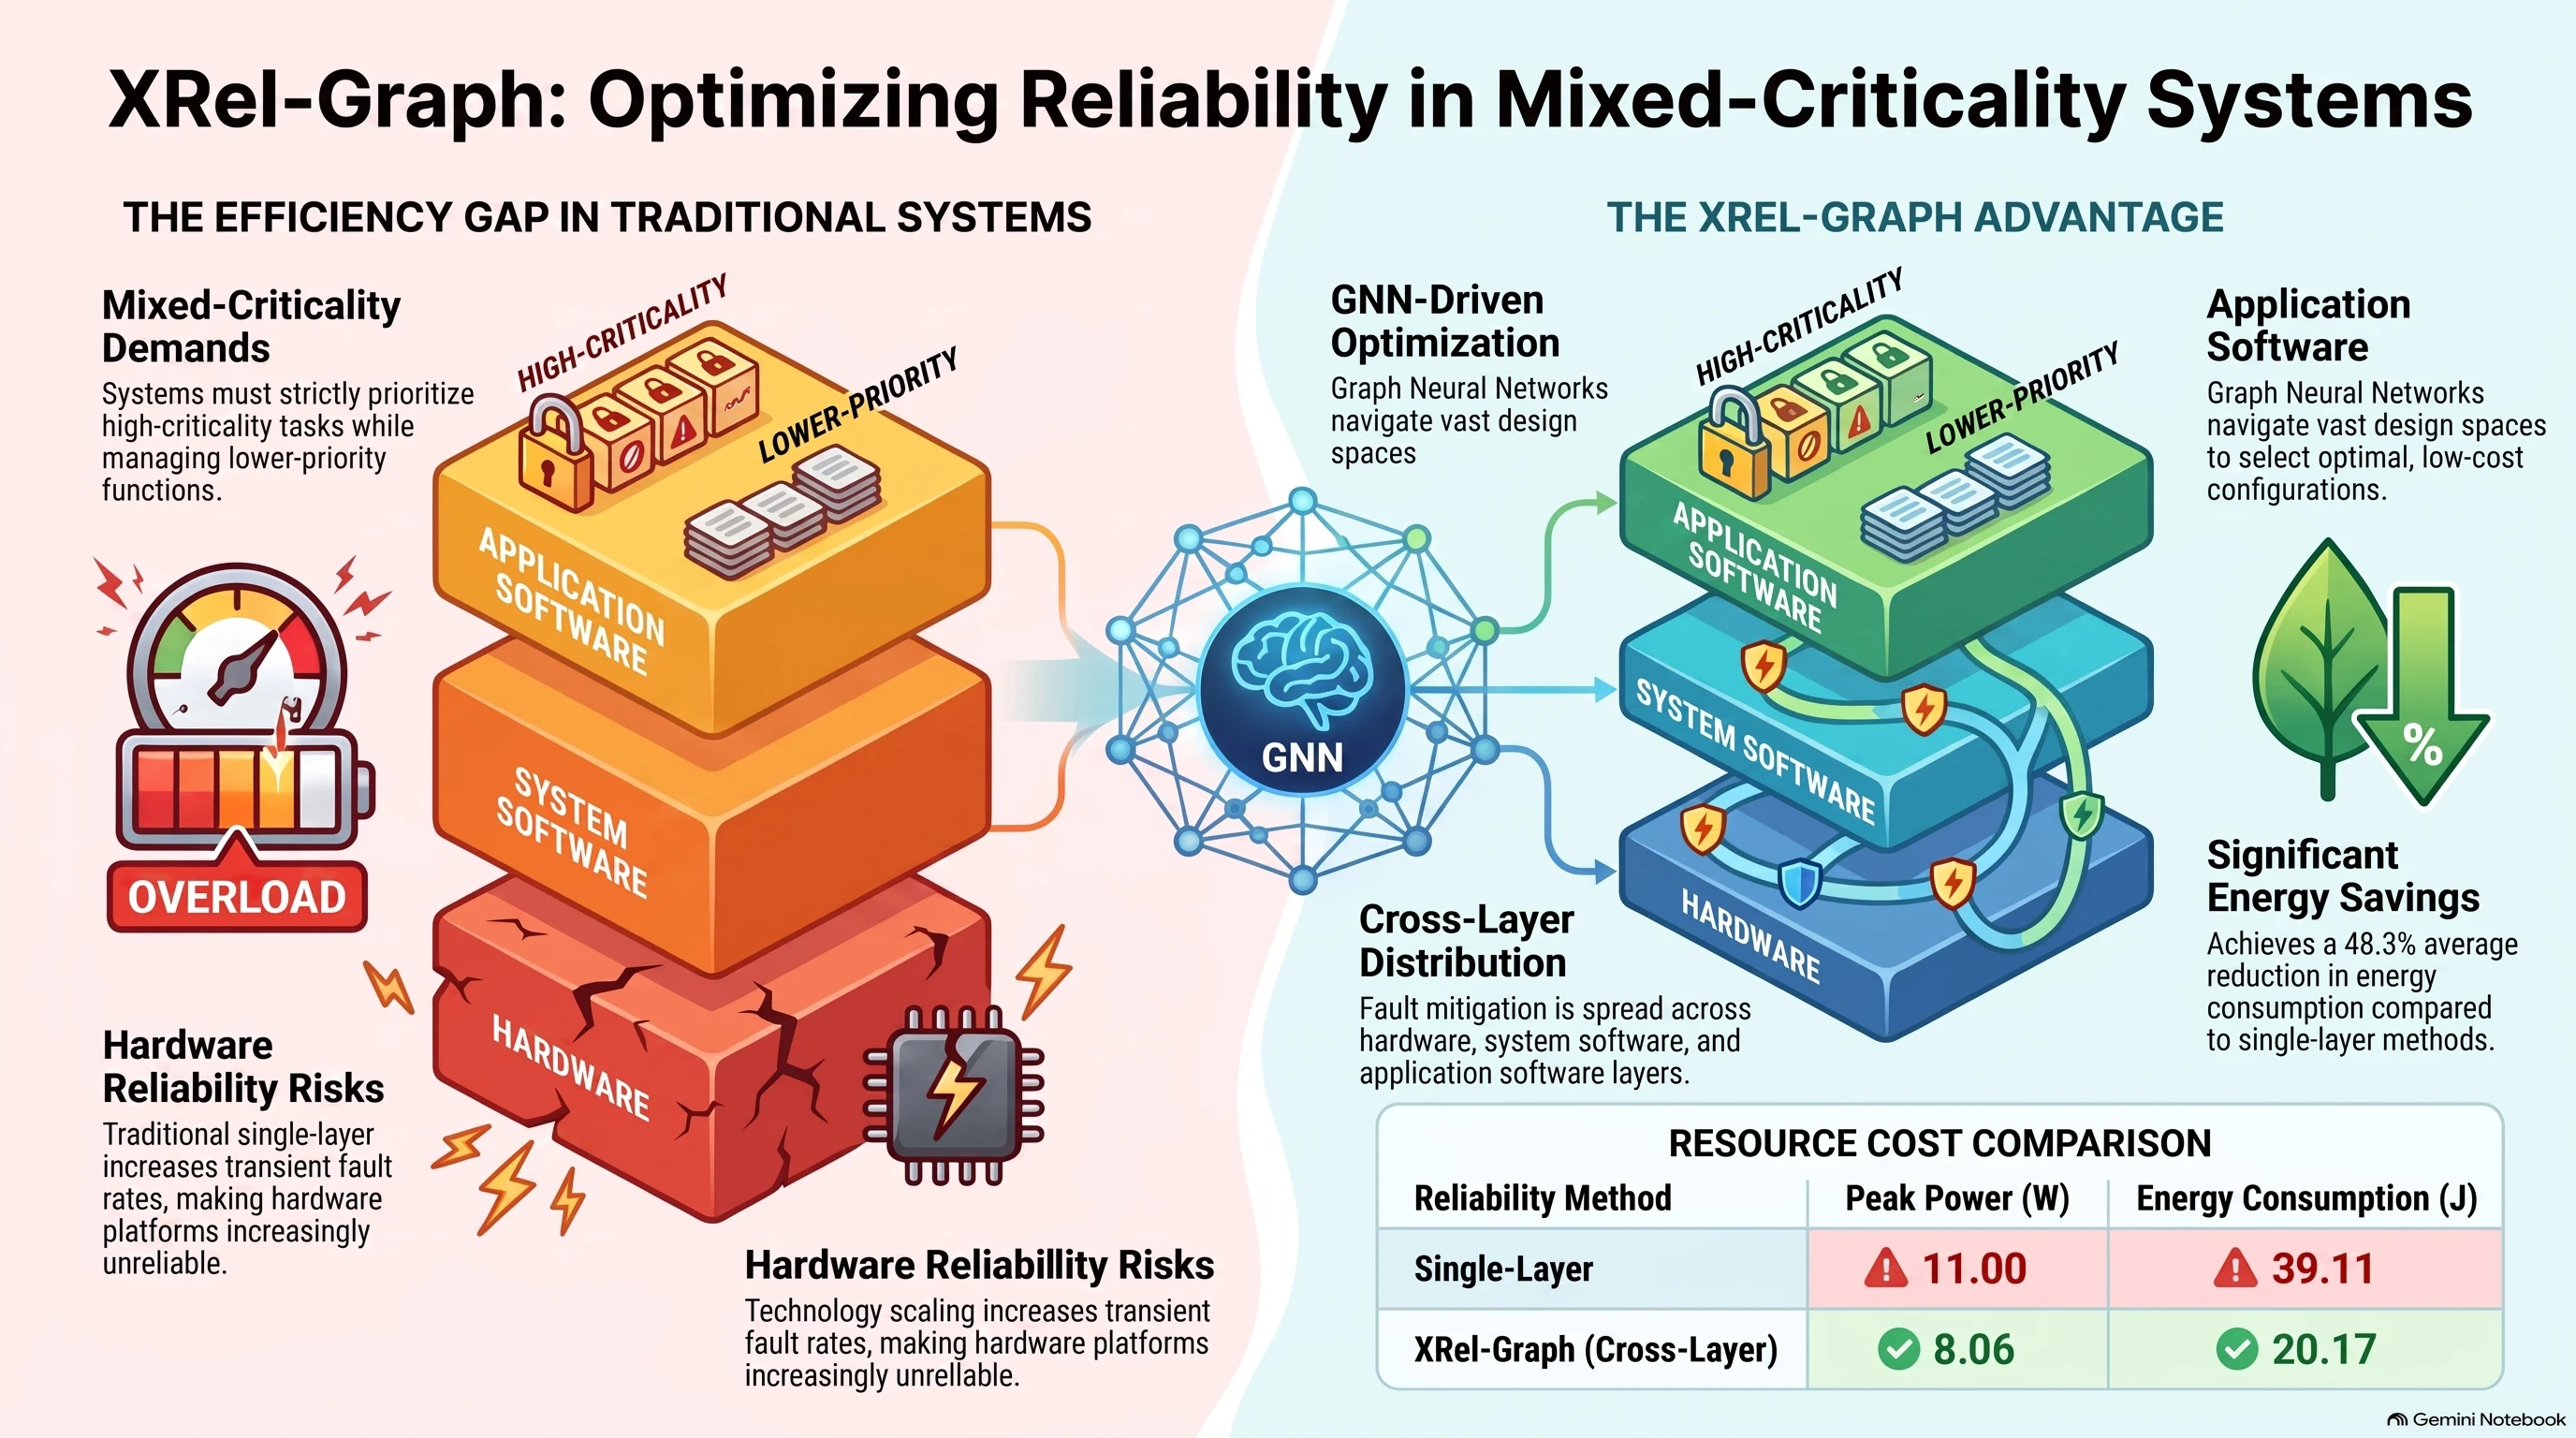
XRel-Graph system reliability infographic comparing isolated single-layer protection with graph-learning-driven cross-layer reliability management
Instead of concentrating fault mitigation in hardware, XRel-Graph distributes protection across hardware, system software, and application software while reducing peak power and energy consumption.
MAP

Concept relationships

From system requirements to measured gains

Four coupled decisions shape an XRel-Graph configuration.

A valid design must reconcile mixed-criticality requirements, layer-specific mitigation costs, topology-aware task decisions, and system-level verification of power, energy, timing, and reliability.

XRel-Graph
HC and LC tasksDifferent failure-rate requirements within one application
LO and HI modesExecution behavior changes when critical demand rises
ISO 26262 PFH targetsASIL-C and ASIL-A constrain acceptable configurations
End-to-end deadlineRecovery overhead must remain schedulable
02

The approach

Allocation before optimization

Treat fault tolerance as a portfolio of interventions.

XRel-Graph does not invent a new redundancy primitive. Its contribution is deciding where familiar mechanisms are worth their cost. Candidate portfolios combine spatial, temporal, and information redundancy at task granularity; infeasible mappings are removed before learning ranks the remaining choices.

One application · several protection budgets

The same mechanism is not forced across the graph. Each system layer offers a distinct way to spend reliability overhead.

Application softwareInformation redundancy

Protect encoded state without duplicating the complete compute path.

Best when representation-level protection is available
System softwareRe-execution · checkpointing

Trade available timing slack for recovery with limited hardware cost.

Best when successors can absorb the recovery interval
HardwareModular redundancy · DVFS

Spend power and area where failure consequences justify stronger isolation.

Best for critical paths with little recovery slack

Selection is joint: changing one layer changes the feasible choices in the others.

03

Learning and verification

A deliberately split responsibility

Graph learning supplies context; verification keeps the final say.

Observe

Read beyond the current task

Message passing carries predecessor, successor, mapping, and criticality context into each task embedding before a configuration is scored.

Rank

Compare only schedulable candidates

Configuration calculation constructs the legal decision set first. Learning searches this structured set instead of spending capacity rediscovering basic feasibility rules.

Verify

Keep safety outside the bargain

Energy, power, and finish time may trade against one another. Criticality-specific PFH targets and the application deadline remain acceptance gates, not preferences.

Learned ranking

01

Topology and dependency context

02

Energy, power, and finish-time trade-offs

03

Task-level configuration probabilities

Hard acceptance gates

≤ 10−7High-criticality PFH
≤ 10−5Low-criticality PFH
≤ deadlineEnd-to-end finish time
04

Measured impact

Efficiency under fixed constraints

The gain comes from changing the allocation pattern—not weakening the contract.

Across 100 synthetic task sets, XRel-Graph met the PFH targets for both criticality levels. Cross-layer allocation reduced energy and peak power relative to single-layer protection and prior mixed-criticality policies; on the LiDAR application, it found a compliant configuration in seconds rather than exhaustive-search hours.

Against one-layer protection

Less overhead, same required PFH.

Energy−48.32%
Peak power−27.55%

Against prior policies

The cross-layer search finds a different frontier.

Peak power−76.67%
Energy−50.54%

Autonomous LiDAR case

Seconds instead of exhaustive hours.

4.67 sXRel-Graph
≈15 hExhaustive search

Both are evaluated against the same PFH and real-time requirements.

05

Details

Benchmark progression

The safety boundary holds from synthetic task sets to autonomous LiDAR.

Synthetic task graphs increase in complexity while the criticality-specific PFH limits and end-to-end deadline remain fixed. On the LiDAR application, the learned search reaches a compliant configuration in 4.67 seconds instead of roughly 15 hours of exhaustive enumeration.
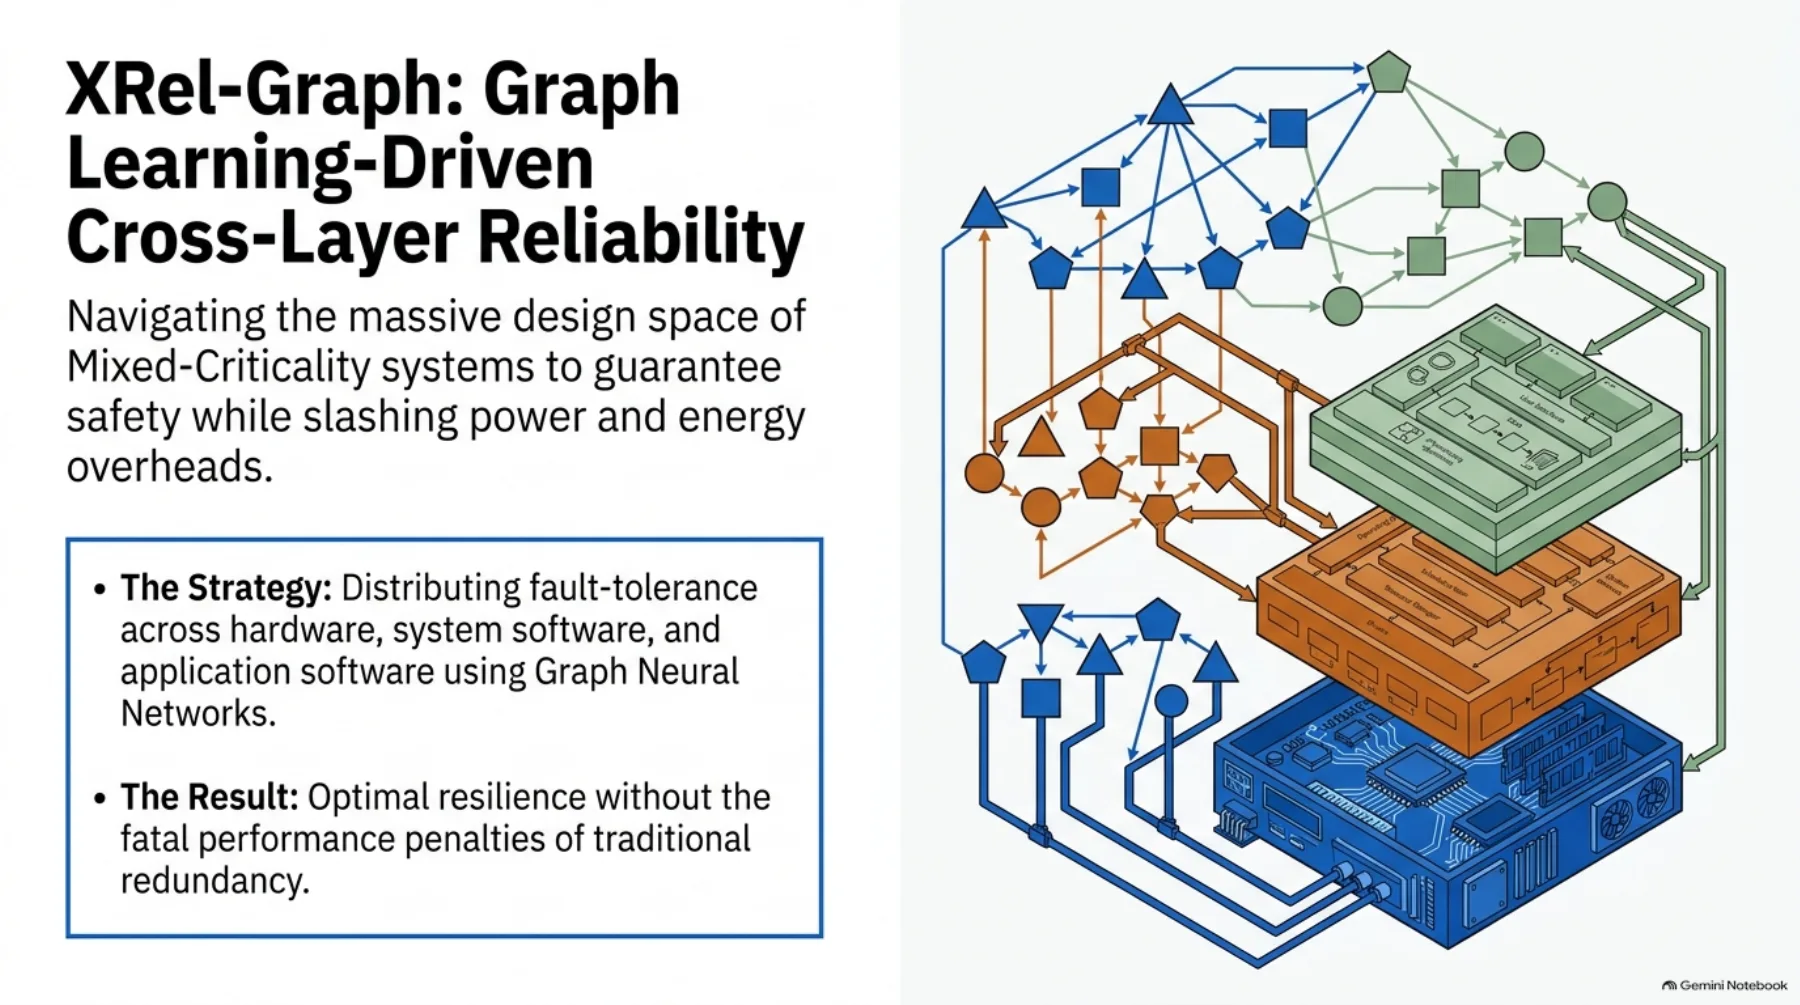
Presentation slide 1: XRel-Graph overview

01XRel-Graph overview

06

Watch

Configuration walkthroughs

A task graph becomes a verified cross-layer configuration.

Quick overview

XRel-Graph in brief

Isolated mitigation spends too much power; XRel-Graph assigns protection where each task can use it most efficiently.

Detailed presentation

Graph learning-driven reliability management

Message passing ranks task-level configurations before PFH and deadline checks accept or reject the complete mapping.

07

Publication

DAC 2026

XRel-Graph at the Design Automation Conference.
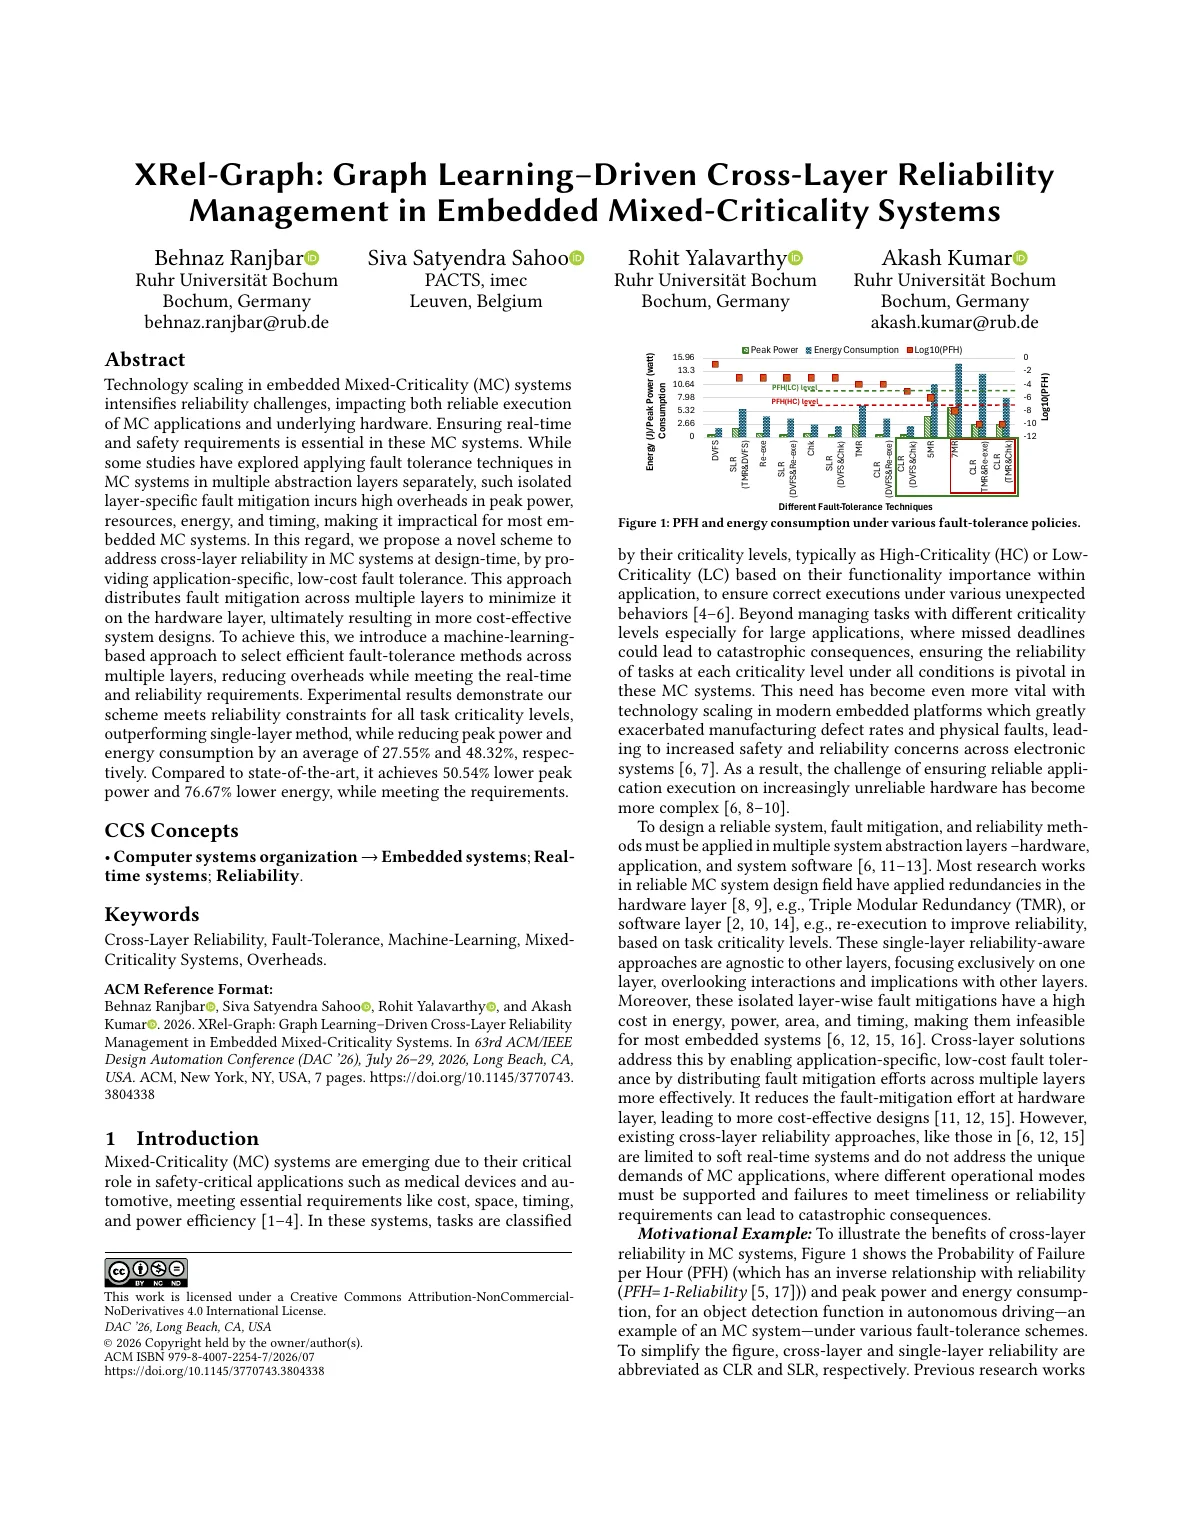
First page of the published XRel-Graph articleOpen published article ↗

Behnaz Ranjbar, Siva Satyendra Sahoo, Rohit Yalavarthy, and Akash Kumar. “XRel-Graph: Graph Learning–Driven Cross-Layer Reliability Management in Embedded Mixed-Criticality Systems.” In the proceedings of the 63rd ACM/IEEE Design Automation Conference (DAC ’26), Long Beach, California, USA, 26–29 July 2026.

DOI · 10.1145/3770743.3804338

01

Behnaz Ranjbar

Chair of Embedded Systems

Ruhr University Bochum · Bochum, Germany

02

Siva Satyendra Sahoo

Pathfinding Co-optimization Technology & Systems

imec · Leuven, Belgium

03

Rohit Yalavarthy

Chair of Embedded Systems

Ruhr University Bochum · Bochum, Germany

04

Akash Kumar

Chair of Embedded Systems

Ruhr University Bochum · Bochum, Germany

Continue exploring the research landscape

Dependable Systems →